
Real-world evidence is often presented as the answer to the limitations of traditional clinical trials. It can be faster to generate, more reflective of routine practice, and better suited to some decision contexts. However, these advantages do not remove the central challenge of evidence interpretation, such as distinguishing genuine treatment effects from misleading signals.
Healthcare decision makers are increasingly asked to interpret and act on a growing range of evidence types: before-and-after studies, retrospective analyses, observational cohorts, registry data, pragmatic trials, and more. Each evidence type brings their own strengths and weaknesses and, although we often speak of a “hierarchy of evidence”, none are inherently “good” or “bad”. Whether evidence comes from a randomised trial, a registry, or a retrospective database, the key question remains the same: how confident are we that the observed effect was actually caused by the intervention? In this blog, we explore the foundational biases of causal inference and how to integrate diverse data types to make defensible choices for health systems.
Understanding bias
When evaluating any clinical data, it is essential to think in terms of “cause and effect” (or, in scientific terms: “causal inference”). When we read the results of a clinical study, does the intervention truly cause the observed outcome or could something else explain the effect? Here are three foundational biases that we should always look out for:
1. Regression to the mean
This occurs when patients are selected for treatment at a point of unusually severe symptoms. For example, imagine that a cohort of patients is referred for a new migraine therapy when their symptoms are particularly bad. Six months later, migraine frequency has improved. Was it the therapy? Possibly. But many patients fluctuate naturally over time. If we measure them at a peak, improvement may occur regardless of intervention. Without a control group, this natural fluctuation can masquerade as treatment effect.
2. Placebo effect
Patients often improve simply because they believe they are receiving effective treatment. For example, a new injectable therapy for chronic pain might show a 30% reduction in pain scores in an uncontrolled study. However, we know from many blinded trials that placebo injections alone can produce substantial pain reduction, because severity of pain is driven by perception as well as a physical presence. If the intervention is not compared against a blinded control, it is difficult to separate the true treatment effect from imagined effects. The placebo effect is usually more of a problem for patient-reported outcomes than for ‘hard’ clinical outcomes, but can affect both.
3. Confounding
Confounding occurs when another variable influences both treatment allocation and outcomes. For example, in observational data, patients receiving a new innovative therapy might appear to have better survival than those on standard therapy. But perhaps those people received the treatment because they are younger, wealthier, treated at tertiary centres, or have fewer comorbidities. These characteristics may explain the difference, rather than an actual treatment effect. Another classic example is to show that, at an aggregated national level, the risk of dying when in hospital is far higher than the risk of dying when not in hospital. Nobody would interpret this as meaning that hospitals should always be avoided, because we realise that a confounding factor is at play (e.g. that sick people go to hospital, and that sick people are more likely to die). Statistical adjustment can help in some cases, but it cannot correct for unmeasured confounders (which, by their definition, are unknown).
Why randomised controlled trials became the norm
Addressing the three biases that I outlined above is simple in principle. First, ensure that we include a control group. Second, randomise patients to either the intervention or comparator.
The control helps to rule out regression to the mean. Randomisation ensures that known and unknown confounders are balanced between groups, at least in statistical expectation. Blinding (i.e. not telling patients or healthcare professionals which therapy the person is receiving) further reduces placebo and measurement bias. Thus, we have the randomised controlled trial (RCT).
The modern RCT emerged in the mid-20th century. One of the most influential advocates for rigorous evaluation was Archie Cochrane. In his seminal 1972 book, ‘Effectiveness and Efficiency’, he argued that healthcare systems should fund interventions proven effective through controlled trials. His ideas eventually underpinned the evidence-based medicine movement and institutions such as the Cochrane group.
RCTs were initially criticised by many doctors and the public as impractical, unethical, or overly academic. Over time, methodological innovation (pragmatic trials, cluster randomisation, adaptive designs) addressed many of these concerns and confidence in the approach grew.
The rise of “real-world evidence”
The term “real-world evidence” has gained traction across regulators, HTA agencies, and industry. I am not a fan of the phrase: it subtly implies that RCTs are somehow not conducted in the real world. They are! Patients, clinicians, and hospitals in RCTs are not fictional constructs.
A more accurate label might be “non-randomised evidence”. That said, I’m not influential enough to change the name and, in any case, the prominence of “Real-world evidence” is understandable. There are some very good reasons why: (i) many RCT designs exclude elderly patients or those with multimorbidity, (ii) rare adverse events may only emerge post-launch, (iii) some devices cannot be blinded, (iv) RCTs can take a long time to set up, (v) the fast innovation for some interventions means that iterative changes complicate traditional trial models (e.g. by the time the trial completes, the intervention has changed) (vi) the tight adherence protocols and routine monitoring in RCTs might not reflect actual practice, and (vii) placebo comparators may be unethical. Hands up if you’d willingly take part in a blinded randomised controlled trial to evaluate the effectiveness of parachutes.
There are, of course, some less robust motivations for using non-randomised data, including: (i) avoiding the cost and complexity of RCTs, (ii) seeking approval based on weaker causal inference, (iii) commercial, rather than societally beneficial time pressures.
Despite it being understandable why non-RCT data is used in some circumstances, the key biases remain. Decision makers must be mindful of the risk of regression to the mean, placebo effects*, and confounding. These do not disappear simply because a dataset is large. Large datasets can produce systematically “wrong” results.
*The placebo effect raises a deeper question. If patients genuinely improve due to expectation or contextual factors, should a public health system fund interventions that primarily generate placebo responses? In systems such as the National Health Service, decisions are constrained by opportunity cost. Funding one intervention means not funding another. If a placebo effect improves quality of life at low cost and minimal harm, there is a legitimate economic argument to consider it. But that is a broader ethical and philosophical discussion deserving its own analysis – another blog!
Integrating randomised and non-randomised evidence
The RCT is not doomed. We do not need to ask: “should we use RCT or non-RCT data?” because we can use both. Randomised and non-randomised evidence answer different questions. RCTs tell us whether an intervention works under controlled conditions and rule out biases. Non-randomised evidence shows us how a treatment performs in broader practice.
One methodological approach is to integrate both within frameworks such as network meta-analysis. Non-randomised data can be included but assigned adjustable weights, reflecting their higher risk of bias. Sensitivity analyses can then increase or decrease the weighting of non-randomised evidence, quantify how much it shifts cost-effectiveness estimates and reveal whether decisions are robust or fragile. If a treatment is only cost effective when heavily relying on non-randomised data, decision makers should recognise that uncertainty explicitly.
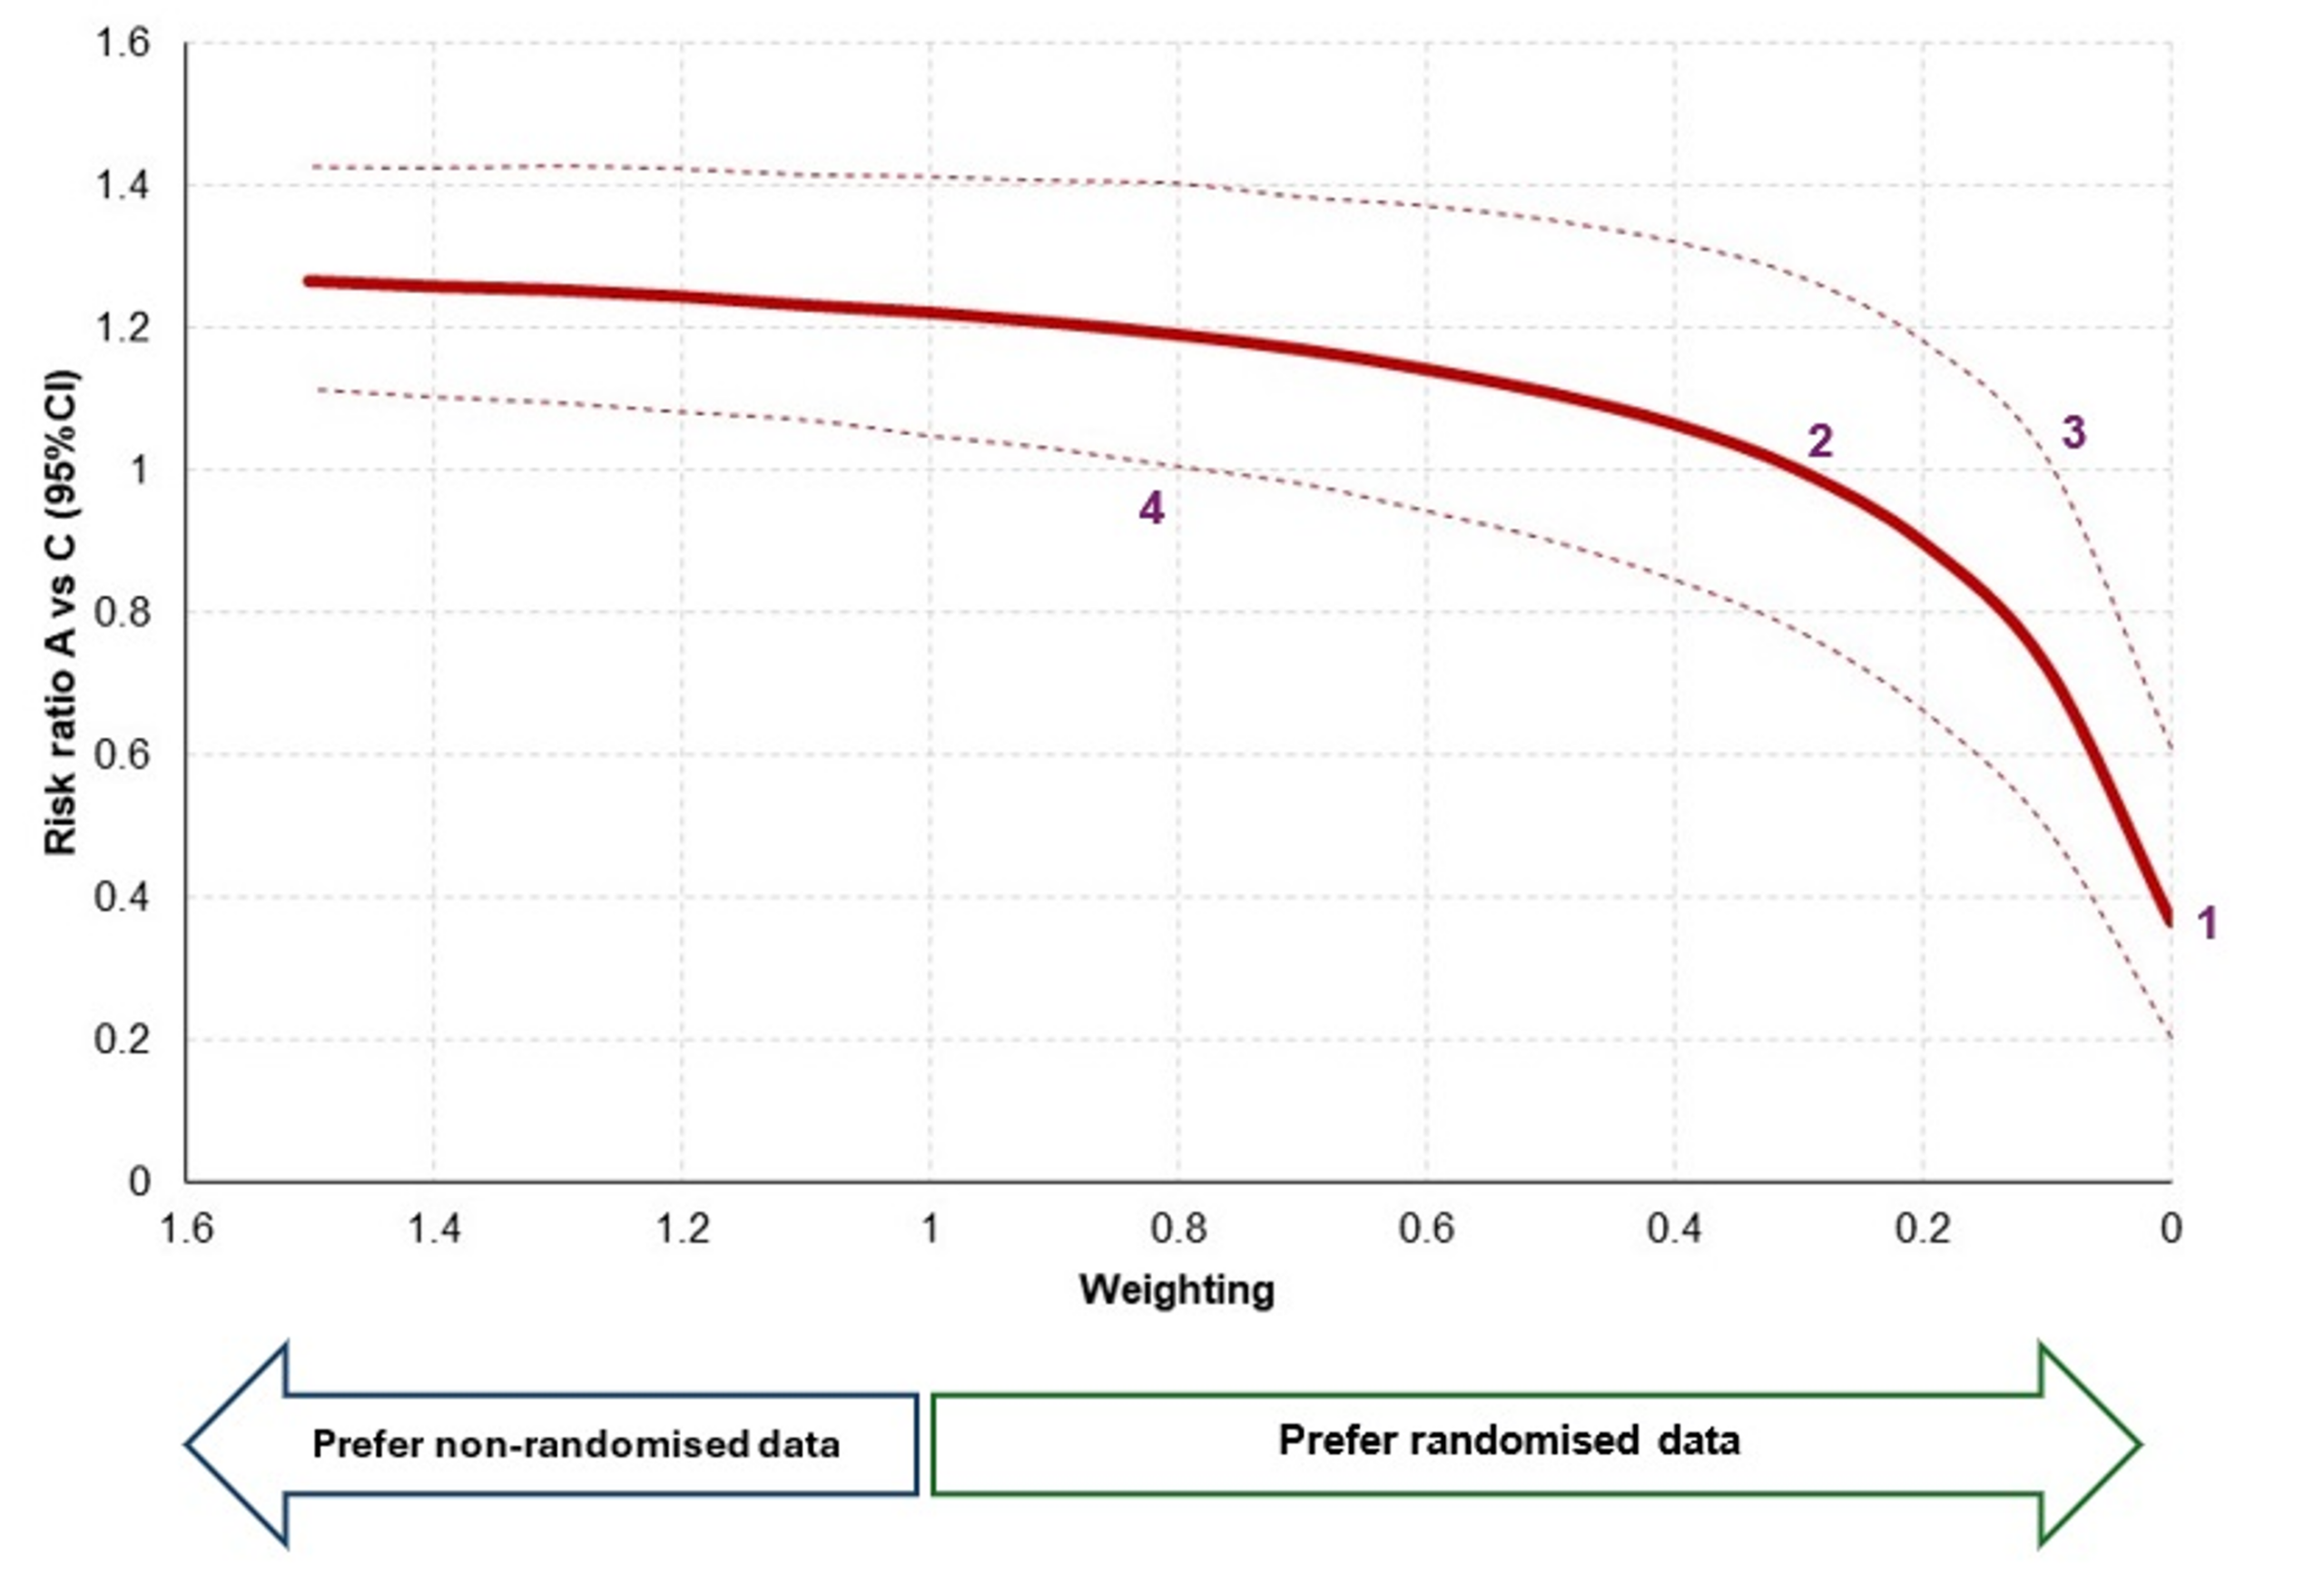
In the example below, I have run a small network meta-analysis with and without non-randomised evidence. The x axis represents the weighting for non-randomised evidence. A score of exactly ‘1’ means that non-randomised evidence is considered just as valuable as randomised evidence. A weighting of ‘0’ means that it has no value at all. In this example, it can be seen that when no value is placed on non-randomised evidence (i.e. only RCT data is included), the risk ratio for Treatment A versus C is approximately 0.38 [Point 1], and the confidence interval is 0.20 to 0.60. Therefore, without the use of observational data, we might conclude that people receiving Treatment A are statistically less likely to experience an event than people receiving Treatment C. However, as we start to introduce non-randomised data (i.e. move ‘left’ on the x axis), we notice that the new evidence starts to nudge the risk ratio upwards. At some point around a weighting of 0.3 [Point 2], the risk ratio increases past 1.00, which means that, if we value non-randomised data as at least 30% as valuable as randomised data, then it becomes more likely that Treatment A causes more events (rather than fewer). Uncertainty is also an important factor, and [Point3] and [Point 4] both denote points at which the confidence interval crosses 1.00, signifying statistical significance.
This sensitivity analysis can be hugely informative for decision makers. Rather than only seeing one scenario (‘with non-randomised data’ or ‘without randomised data’), decision makers can explicitly see how the use of non-randomised data might impact the conclusions of the study. This will then allow for further debate around the specific weighting of non-randomised data, perhaps informed by the likelihood of biases and representativeness of the data.
Should standards differ by technology type?
Whilst my thoughts above cover what is already known, there are many unresolved issues. For example, should evidentiary thresholds differ for drugs vs devices vs digital health? Should national HTA bodies apply stricter criteria than regional or local decision makers? What should we do when no randomised evidence exists?
There may be pragmatic reasons for differentiation for intervention types. Devices and digital tools often evolve more rapidly than pharmaceuticals. However, the underlying principles of causal inference do not change by sector. So, if no RCT evidence exists, we should explicitly model uncertainty, quantify structural bias risk, fully characterise that uncertainty in economic modelling and potentially apply a penalty via conservative assumptions.
This is not punitive; it simply reflects opportunity cost. Healthcare budgets are finite, and diverting funding from established, effective treatments to uncertain innovations requires strong justification. Money does not grow on trees, and every funding decision displaces something else.
“Real-world evidence” is neither a saviour nor a villain. It is simply non-randomised evidence, with strengths and vulnerabilities. The central discipline remains the same as any interpretation of evidence. We should aim for rational, defensible decision making under uncertainty. If we can remember this, we will make better choices for patients and health systems alike.
Contact us
If you would like support in analysing healthcare data, either randomised or non-randomised, please contact us.
Useful resources
- Vatkar A, Kale S, Shyam A, Srivastava S. Understanding the levels of evidence in medical research. Journal of orthopaedic case reports. 2025 May;15(5):6.
- Barnett AG, Van Der Pols JC, Dobson AJ. Regression to the mean: what it is and how to deal with it. International journal of epidemiology. 2005 Feb 1;34(1):215-20.
- Avins AL, Pressman A, Ackerson L, Rudd P, Neuhaus J, Vittinghoff E. Placebo adherence and its association with morbidity and mortality in the studies of left ventricular dysfunction. Journal of general internal medicine. 2010 Dec;25(12):1275-81.
- Skelly AC, Dettori JR, Brodt ED. Assessing bias: the importance of considering confounding. Evidence-based spine-care journal. 2012 Feb;3(01):9-12.
- Crofton J. The MRC randomized trial of streptomycin and its legacy: a view from the clinical front line. Journal of the Royal Society of Medicine. 2006 Oct;99(10):531-4.
- Cochrane. Celebrating Archie Cochrane. 2023. Available from: https://www.cochrane.org/about-us/news/celebrating-archie-cochrane
- Bothwell LE, Kuo WH, Jones DS, Podolsky SH. Social and scientific history of randomized controlled trials. InPrinciples and practice of clinical trials 2022 Jul 20 (pp. 3-19). Cham: Springer International Publishing.
- Yeh RW, Valsdottir LR, Yeh MW, Shen C, Kramer DB, Strom JB, Secemsky EA, Healy JL, Domeier RM, Kazi DS, Nallamothu BK. Parachute use to prevent death and major trauma when jumping from aircraft: randomized controlled trial. bmj. 2018 Dec 13;363.
- Pastor M, Feneratorius D. Looking backward 2143-1943: the rise and fall of the RCT. Value in Health. 2019 May 1;22(5):607-10.
- Daigl M, Abogunrin S, Castro F, McGough SF, Sturrup RH, Boersma C, Abrams KR. Advancing the role of real-world evidence in comparative effectiveness research. Journal of comparative effectiveness research. 2024 Dec;13(12):e240101.